Finding Turty using Python and OpenCV
Aim
Calculate the geographic coordinates of Turty (beast turtle) using a drone photo, flight log and python.
Background
I used to build drones at the University of Queensland. My objective was to capture high resolution 3-dimensional models of remediated landscapes so that we could identify and track topsoil erosion (top 30cm of soil). The drones I built were amateur at best, but they worked and they took reasonable photos so the modelling wasn't too bad either. As an ecologist, one idea that has stuck with me was the value of drones for tracking animals or mapping plants. In this note I use a mock scenario to see how easy it would be to go from drone photo to map coordinates. Given that most of the technical challenges are handled by Python and OpenCV (computer vision) the only thing left for me to do was to half bake a little trig.
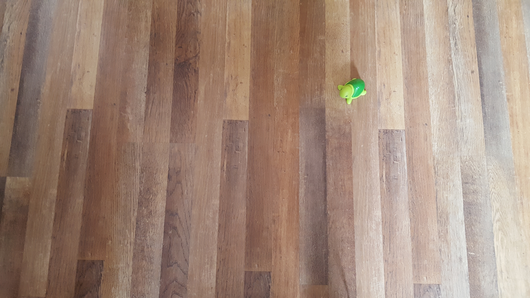
First things first, meet Turty
Turty is a land dwelling bath guy. He enjoys short slow walks and his favourite colour is green. He misses his bath.

Introducing the camel
Believe it or not this dogs breakfast flew. This was revision 2 and not the worst of the bunch so it gets a mention here. While this is completely irrelevant to this hypothetical it does help to add some realism to the story.

Scenario
Before we get into code its best to get the scenario sorted. So what's happening? We are going to fly this camel of a drone over Sydney, Australia (FYI CASA this didnt actually happen) and we're going to take photos as we go. Because I am looking for Turty I am going to tilt the camera up at 10 degrees so that the photos cover a larger area. We reckon turty is big enough to see in the distance. We'll start off flying south for 1 km (beyond line-of-sight) and return flying in parallel by 100 meters. The flight should take approximately 20 minutes to complete. After the flight has taken place the photos are reviewed and any sightings are reported with photo and the flight log containing geospatial data. Now determine Turty's position in the landscape.
Flight log
The flight log is typically a CSV file. However, our colleagues have kindly processed some variables for us and stored these data in a dictionary. Thanks guys.
log = {"alt": 100,        # Meters
       "lat": 6251570,    # UTM zone 56 (sydney - from wiki)
       "lon": 334375,     # UTM zone 56 (sydney - from wiki)
       "yaw": 188,        # Degrees (south)
       "roll": 0,         # Not required because of gimbal
       "pitch": 0,        # Not required because of gimbal
       "gimbalx": 0,      # Not used
       "gimbaly": 10      # Fixed position tilted up
      }

cam = {"camWidth": 3840,  # pixels
       "camHeight": 2160, # pixels
       "camFOVv": 90.4,   # vertical degrees
       "camFOVh": 122.6,  # horizontal degrees
      }
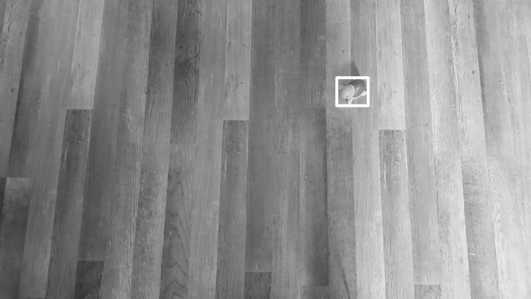
Flight photo
This photo was sent to us along with the flight log and camera specifications. Look at that terrain - harsh. Also look at Turty and check out all his majesty. He's large.
Processing the photo using OpenCV
# libs
import cv2
import numpy as np

# Read photo
img = cv2.imread('turtle/test.jpg', 0)
template = cv2.imread('turtle/template_small.jpg', 0)
w, h = template.shape[::-1]

# Match the template of Turty with the flight photo
res = cv2.matchTemplate(img, template, eval('cv2.TM_CCOEFF_NORMED'))

# Calculate dimensions
min_val, max_val, min_loc, max_loc = cv2.minMaxLoc(res)
top_left = max_loc
bottom_right = (top_left[0] + w, top_left[1] + h)

# Draw rectangle
cv2.rectangle(img, top_left, bottom_right, 255, 20)

# Plot
fig = plt.figure( figsize=(8, 3.75) )
plt.subplot(111), plt.imshow(img, cmap = 'gray')
plt.show()
Mapping Turty
# libs
import cmath
import math
import pandas as pd
import matplotlib.pyplot as plt
from mpl_toolkits.basemap import Basemap
import geopandas as gpd
from shapely.geometry import Point, Polygon
import fiona
%matplotlib inline
import calculateFootprint as cfp # MY LIB


# Use flight and cam logs to create a footprint
photofootprint = cfp.footprint(
        yaw = log["yaw"],
        altitude = log["alt"],
        camHeight = cam["camFOVv"],
        camWidth = cam["camFOVh"],
        gimbaly = log["gimbaly"],
        longitude = log["lon"],
        latitude = log["lat"]
)

# Get center position of detected Turty (measured in pixels)
# calculated above (see OpenCV section)
turtyCenterX = top_left[0] + (abs(top_left[0] - bottom_right[0])/2)
turtyCenterY = top_left[1] + (abs(top_left[1] - bottom_right[1])/2)

# Update Y: 0 is in the top left corner
turtyCenterY = img.shape[::-1][1] - turtyCenterY

# get photo dimensions from field of view which are mapped to a polygon shape (meters)
top = log["alt"] * math.tan(math.radians(log["gimbaly"] + 0.5 * cam["camFOVv"]))
bottom = log["alt"] * math.tan(math.radians(log["gimbaly"] - 0.5 * cam["camFOVv"]))
right = log["alt"] * math.tan(math.radians(0 + 0.5 * cam["camFOVh"]))
left = log["alt"] * math.tan(math.radians(0 - 0.5 * cam["camFOVh"]))
photoMapHeight = top + abs(bottom)
photoMapWidth = right + abs(left)

# Create scale to convert photo pixels to meters
# (Number of meters per pixel)
scaleMapWidth = photoMapWidth/cam["camWidth"]
scaleMapHeight = photoMapHeight/cam["camHeight"]

# Use bottom left corner to project Turty
turtyMetersFromBottomLeftCornerX = scaleMapWidth * turtyCenterX
turtyMetersFromBottomLeftCornerY = scaleMapHeight * turtyCenterY

# Calculate distance from zero
turtyDistance = math.sqrt(turtyMetersFromBottomLeftCornerX**2 +
                          turtyMetersFromBottomLeftCornerY**2)

# Calculate angle (from bottom left corner)
turtyAngle = 180 + 90 + math.degrees(math.atan(turtyMetersFromBottomLeftCornerX /
                       turtyMetersFromBottomLeftCornerY))

# project coordinates from bottom left corner
turty = cfp.project(photofootprint[2][0], #lon
            photofootprint[2][1], #lat
            turtyAngle + log["yaw"],
            turtyDistance,
           )

# Add photo footprint
df = gpd.GeoDataFrame()
df['geometry'] = None
pfoot = [(pfp[0], pfp[1]) for pfp in photofootprint]
poly = Polygon(pfoot)
df.loc[0, 'geometry'] = poly
df.crs = fiona.crs.from_epsg(32756)

# Add turty position
geoTurty = gpd.GeoDataFrame()
geoTurty['geometry'] = None
pnt = Point(turty[0], turty[1])
geoTurty.loc[0, 'geometry'] = pnt
geoTurty.crs = fiona.crs.from_epsg(32756)

f, ax = plt.subplots(1)
df.plot(ax=ax)
ax.set_ylim(6251800, 6251450) # Invert Y axis
geoTurty.plot(ax=ax, color="red", markersize=100)
plt.show()

f.savefig('turtle/geoturty.png')
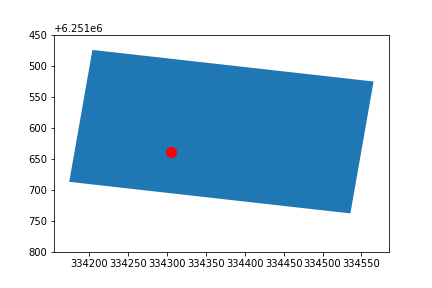
This output shows the footprint of the photo (blue) and the location of Turty (red dot). This photo has been rotated 188 degrees (flying south). Note that the Y axis is descending because latitude increases as the drone flys south.