Histogram
Date: February 22nd 2016
Last updated: February 22nd 2016
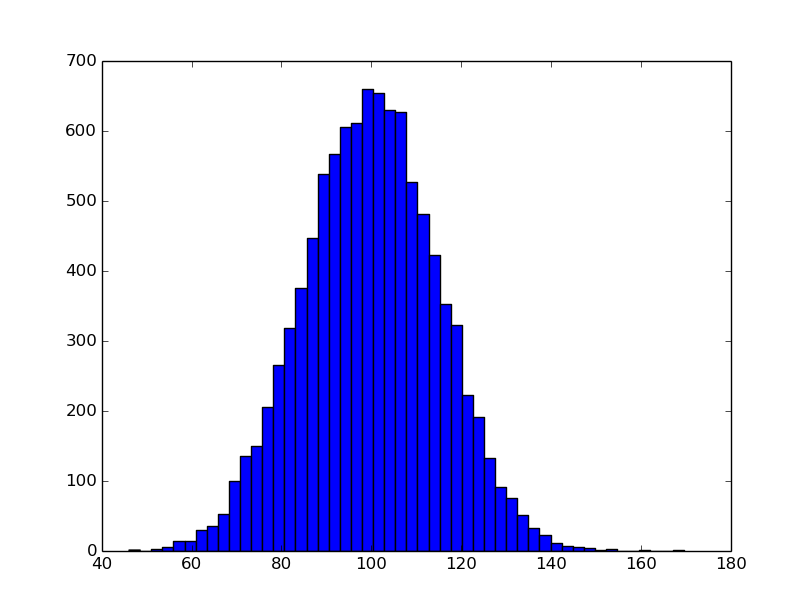
Example 1: Basic histogram: default
import numpy as np
import matplotlib.pyplot as plt

# set mean and sd
mu, sigma = 100, 15

# create distribution of data
x = mu + sigma*np.random.randn(10000)

# build histogram
n, bins, patches = plt.hist(x, 50)
plt.show()
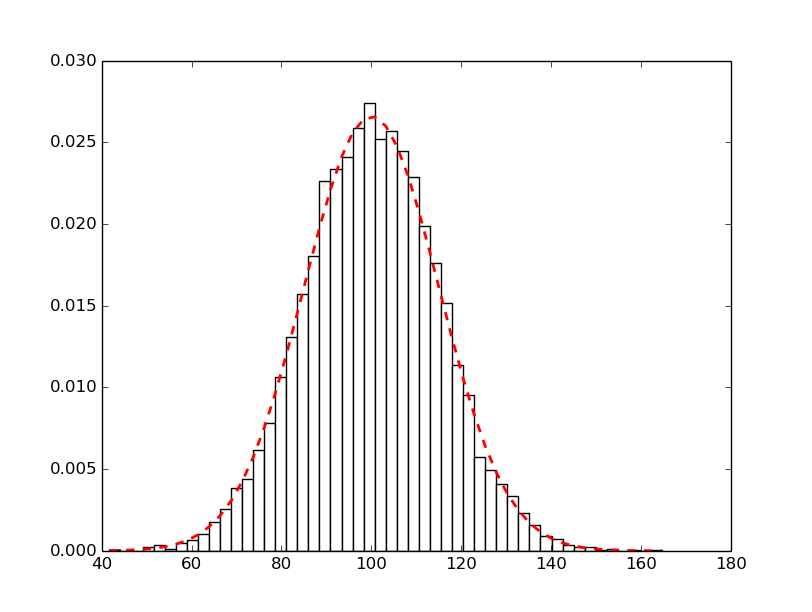
Example 2: Density smoothing/specify bin colour
# Add mlab
import matplotlib.mlab as mlab

# set mean and sd
mu, sigma = 100, 15

# create distribution of data
# x is same as above

# build histogram
Note the use of normed=1 (this is one not an 'L')
n, bins, patches = plt.hist(x, 50, normed=1, facecolor='white')

# add a 'best fit' line
y = mlab.normpdf(bins, mu, sigma)
l = plt.plot(bins, y, 'r--', linewidth=2)

plt.show()
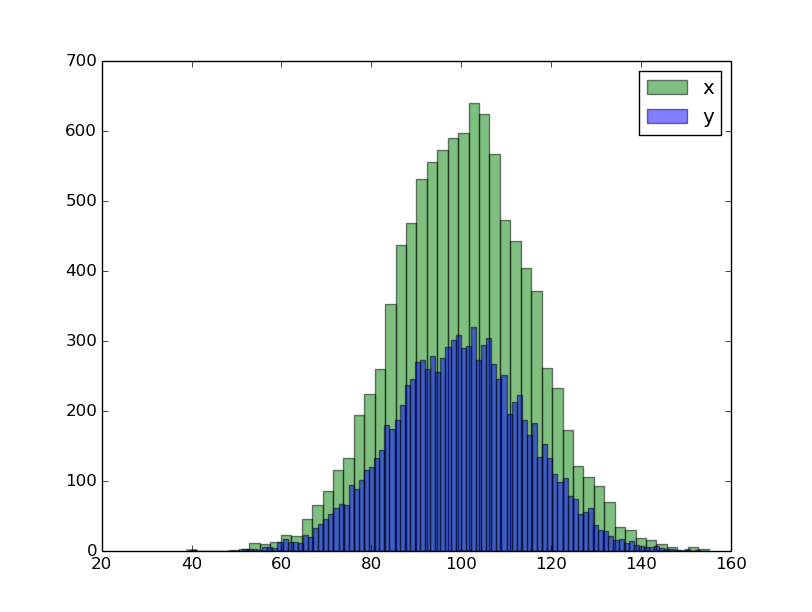
Example 3: Double histograms using alpha
# create data
x = mu + sigma*np.random.randn(10000)
y = mu + sigma*np.random.randn(10000)

# plot x
n, bins, patches = plt.hist(x, 50,
    facecolor='green', alpha=0.5, label='x')

# plot y
# note the increase in bin sizing for Y
n, bins, patches = plt.hist(y, 100,
    facecolor='blue', alpha=0.5, label='y')

# set legend and show the plot
plt.legend(loc='upper right')
plt.show()
Useful resources