Matplotlib adding graph widgets
Date: March 5th 2016
Last updated: March 5th 2016
This code was generated while I was trying to replace ax properties of a matplotlib graph in kivy. However, on my way to figuring out a solution I managed to continously add widgets to a kivy window. Im not sure why you would want to do this, but here it is anyway. Perhaps I might need it in the future.
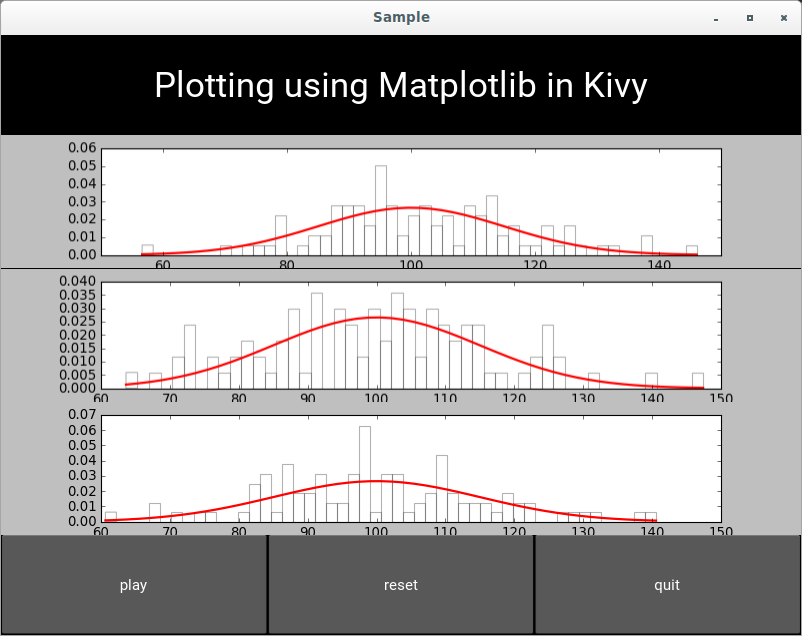
In this example I have used the random.gauss function to create a histogram and a probability density function. As the numbers were derived randomly, each figure looks marginally different.
main.py
"""
Adds graphs to widget position on every click.
None of the graphs are removed.
"""
import matplotlib
matplotlib.use('module://kivy.garden.matplotlib.backend_kivy')
import matplotlib.pyplot as plt
from kivy.garden.matplotlib.backend_kivyagg import FigureCanvas
import kivy
kivy.require('1.9.1')
from kivy.app import App
from kivy.uix.boxlayout import BoxLayout
from kivy.uix.button import Button
import matplotlib.mlab as mlab
from random import gauss
import numpy as np

class DrawPlot(BoxLayout):
    def __init__(self, **kwargs):
        super(DrawPlot, self).__init__(**kwargs)

    def get_data(self):
        x = [gauss(100, 15) for i in range(100)]
        return x

    def draw_my_plot(self):
        fig, ax = plt.subplots()
        x = self.get_data()
        n, bins, patches = ax.hist(x, 50, normed=1, facecolor='white', alpha=0.3)
        pdf = mlab.normpdf(bins, 100, 15)
        ax.plot(bins, pdf, 'r-', linewidth=2)
        canvas =  FigureCanvas(figure=fig)
        self.add_widget(canvas, 1) #<==== This adds a graph above the first row (index=1)

    def callback(self):
        self.draw_my_plot() #<=== add additional widgets on click

class SampleApp(App):
    def build(self):
        return DrawPlot()

if __name__ == '__main__':
    SampleApp().run()
sample.kv
#:kivy 1.9.1
<DrawPlot>:
    orientation: 'vertical'

    BoxLayout:
        orientation: 'vertical'
        size_hint: 1, None
        height: main_title.height

        Label:
            id: main_title
            text: "Plotting using Matplotlib in Kivy"
            font_size: '35sp'
            size_hint: 1, None
            height: self.height

        Label:
            size_hint_x: 0.8
            source: root.draw_my_plot() #<=== initial plot placement

    BoxLayout:
        orientation: 'horizontal'
        size_hint: 1, None
        height: playbutton.height
        Button:
            id: playbutton
            text: 'play'
            size_hint: 1, None
            height: self.height
            on_press: root.callback() #<==== adds a plot on every click
        Button:
            text: 'reset'
            size_hint: 1, None
        Button:
            text: 'quit'
            size_hint: 1, None
Output
In this screenshot I have clicked 'play' twice which as added 2 addition graphs to the widget space. The reset and quit buttons do nothing.