Timeseries
Date: March 1st 2016
Last updated: March 1st 2016
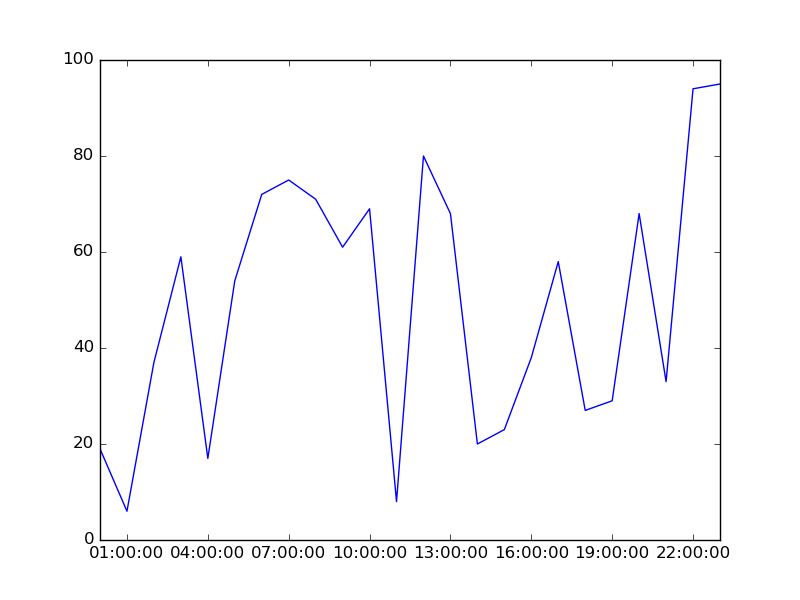
A timeseries plots a response variable on the y axis and time on the x axis.
import matplotlib.pyplot as plt
import datetime
import numpy as np

# Example comes from here:
# http://stackoverflow.com/questions/19079143/how-to-plot-time-series-in-python

# create x axis (note the use of list comprehension here)
x = np.array([datetime.datetime(2013, 9, 28, i, 0) for i in range(24)])

# create response variable of the same length as the x axis (each time point has
# a response
y = np.random.randint(100, size=x.shape)

# plot
plt.plot(x,y)
plt.show()