Best fit polynomial
Date: March 2nd 2016
Last updated: March 2nd 2016
Fitting a polynomial line using numpy. This example is adapted from here: http://stackoverflow.com/questions/18767523/fitting-data-with-numpy
Import modules
import numpy.polynomial.polynomial as poly
import numpy as np
import matplotlib.pyplot as plt
Create data
x = np.arange(1, 50, 1)
y = np.random.randint(50, size=x.shape)
Create linspace
"Return evenly spaced numbers over a specified interval". See http://docs.scipy.org/doc/numpy-1.10.0/reference/generated/numpy.linspace.html
x_new = np.linspace(x[0], x[-1], num=len(x)*10)
Create polyfit
# modify the third number to adjust fit
coefs = poly.polyfit(x, y, 3)
ffit = poly.polyval(x_new, coefs)
Plot data
fig, ax = plt.subplots()
ax.scatter(x, y, facecolors='None')
ax.plot(x_new, ffit)
plt.show()
Output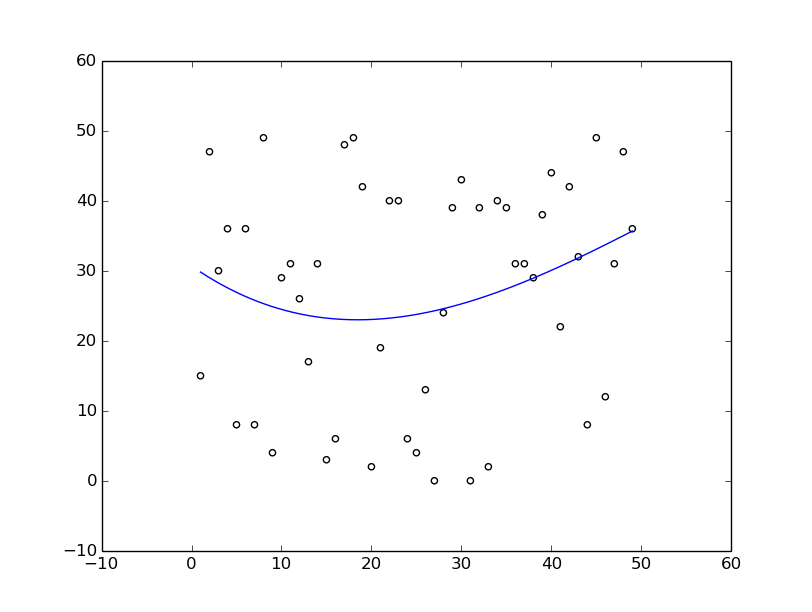
Useful resources