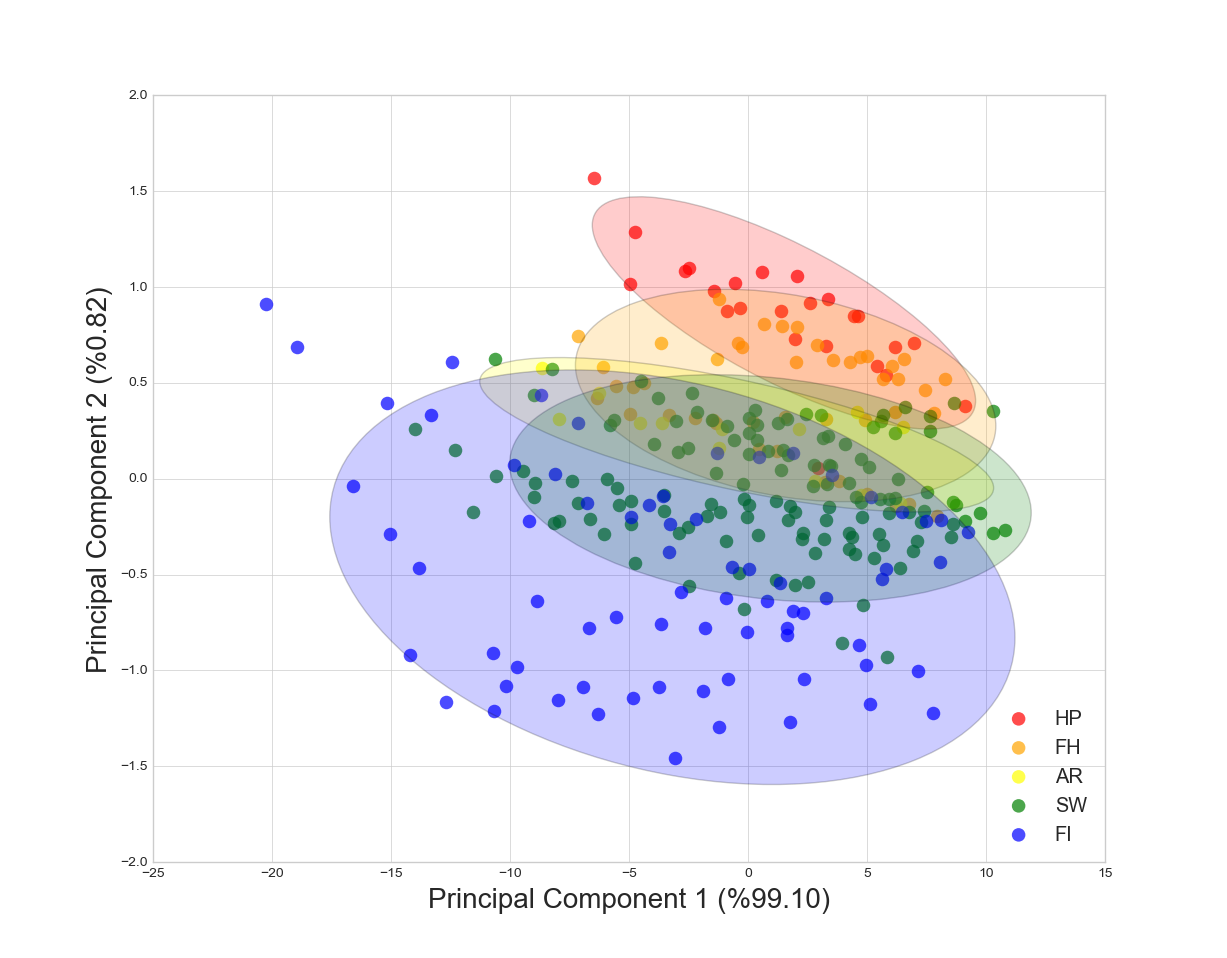
Scatterplot ellipse
Date: April 7th 2016
Last updated: April 7th 2016
This entry borrows a little from analysis/analysis/principle components analysis (PCA). However, the end result is the same if you use a pandas DataFrame containing x and y data.
Useful references
- http://stackoverflow.com/questions/20126061/creating-a-confidence-ellipses-in-a-sccatterplot-using-matplotlib
- http://matplotlib.org/examples/pylab_examples/ellipse_demo.html
from matplotlib import pyplot as plt
import numpy as np
import math
from matplotlib.patches import Ellipse
from sklearn.decomposition import PCA as sklearnPCA

# create two PCA components
sklearn_pca = sklearnPCA(n_components=2)
Y_sklearn = sklearn_pca.fit_transform(x)

# Additional processing of PCA
print(sklearn_pca.components_) #array [ncomponents, nfeatures]
print(sklearn_pca.explained_variance_)  #var explained by each component
print(sklearn_pca.explained_variance_ratio_) #percentage explained by each component

def eigsorted(cov):
    vals, vecs = np.linalg.eigh(cov)
    order = vals.argsort()[::-1]
    return vals[order], vecs[:,order]


with plt.style.context('seaborn-whitegrid'):

    # only one plot
    fig, ax = plt.subplots(figsize=(6, 4))

    for lab, col in zip(('HP', 'FH', 'AR', 'SW', 'FI'),
                        ('red', 'orange', 'yellow', 'green','blue')):

        # The following two lines subset the data based on the factor "lab" above
        # y==lab returns an array of true or false, and the number specifies the
        # column to return from the dataset (here the dataset is Y_sklearn)
        # The output for xdata and ydata is a vector of length that matches 'lab = true'
        xdata = Y_sklearn[y==lab, 0]
        ydata = Y_sklearn[y==lab, 1]

        # get values to build the ellipse
        cov = np.cov(xdata, ydata)
        vals, vecs = eigsorted(cov)
        theta = np.degrees(np.arctan2(*vecs[:,0][::-1]))
        w, h = 2 * 2 * np.sqrt(vals)

        # create the ellipse
        ell = Ellipse(xy=(np.mean(xdata), np.mean(ydata)),
              width=w, height=h,
              angle=theta, color='black', alpha=0.2)

        ell.set_facecolor(col) # reference the colour for each factor (defined by lab)
        ax.add_artist(ell)
        ax.scatter(xdata, ydata,
                  label=lab, # use labels provided above
                  c=col, # use colors provided above
                  lw = 0, #remove the outer line of each point
                  alpha=0.7, # increase transparency of points
                  s=95) # increase the size of points

    # add labels showing percentage of the variance explained
    ax.set_xlabel('Principal Component 1 (%{:.2f})'.format(sklearn_pca.explained_variance_ratio_[0]*100), fontsize=20)
    ax.set_ylabel('Principal Component 2 (%{:.2f})'.format(sklearn_pca.explained_variance_ratio_[1]*100), fontsize=20)

    plt.legend(loc='lower right')
    plt.show()
Output