Normal distribution
Date: February 27th 2016
Last updated: February 27th 2016
You can produce a normal distribution using mean and standard deviation, or by using mean zero and sigma.
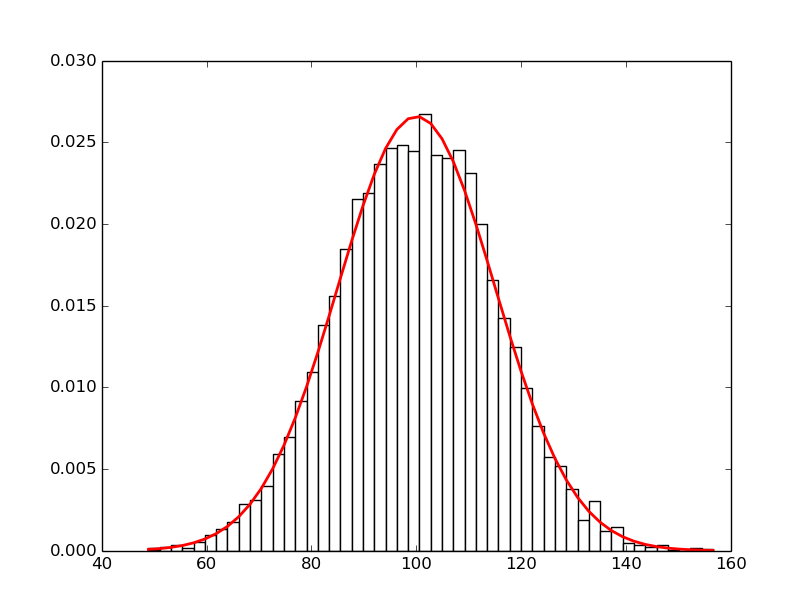
Mean and SD
import matplotlib.pyplot as plt
import matplotlib.mlab as mlab
from random import gauss

mu, sigma = 100, 15
x = [gauss(mu, sigma) for i in range(10000)]

# histogram
n, bins, patches = plt.hist(x, 50, normed=1, facecolor='white')

# pdf
pdf = mlab.normpdf(bins, mu, sigma)
plt.plot(bins, pdf, 'r-', linewidth=2)

plt.show()
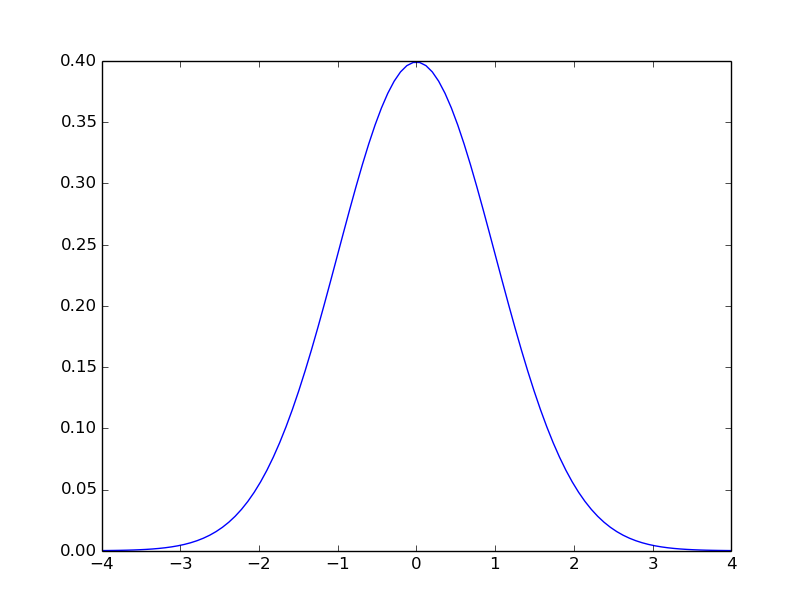
Mean zero and sigma
import matplotlib.pyplot as plt
import matplotlib.mlab as mlab
import numpy as np

mu, sigma = 0, 1.0
x = np.linspace(-4, 4, 100)
plt.plot(x, mlab.normpdf(x, mu, sigma))
plt.show()