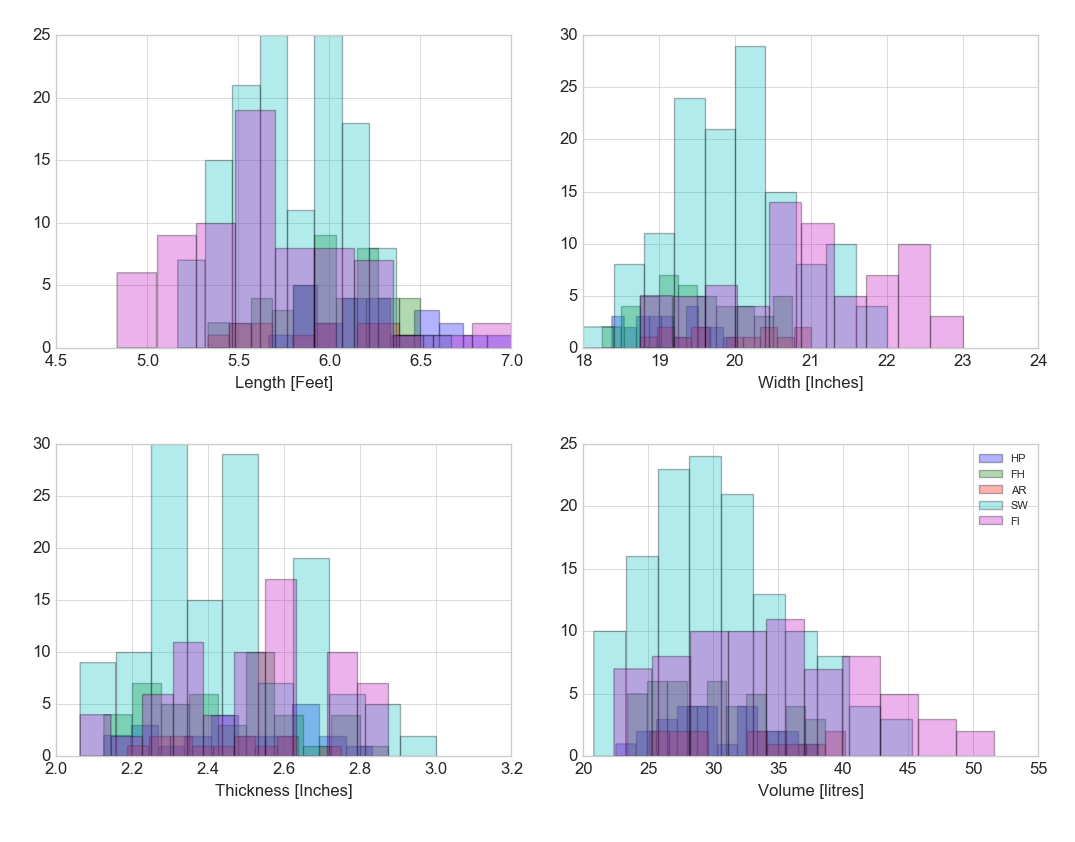
Group of histograms
Date: April 6th 2016
Last updated: February 21st 2017
The data for this example is extracted from a mysql database (not shown here). See analysis/analysis/multiple regression. Then, it is arranged in a pandas dataframe.
Split data
# Exploratory plotting
from matplotlib import pyplot as plt
import numpy as np
import math

label_dict = {1: 'HP',
              2: 'FH',
              3: 'AR',
              4: 'SW',
              5: 'FI'}

feature_dict = {0: 'Length [Feet]',
                1: 'Width [Inches]',
                2: 'Thickness [Inches]',
                3: 'Volume [litres]'}

with plt.style.context('seaborn-whitegrid'):
    plt.figure(figsize=(8, 6))
    # loop over the four measurements
    for cnt in range(4):
        # create a two by two plot frame
         # specify each plot with cnt
        plt.subplot(2, 2, cnt+1)
        for lab in ('HP', 'FH', 'AR', 'SW', 'FI'):
            # y==lab returns an array of true or false
            # cnt specifies the column to return in x
            # returns a vector for each column where
            # lab returns true
            plt.hist(x[y==lab, cnt],
                     label=lab,
                     bins=10,
                     alpha=0.3,)
        plt.xlabel(feature_dict[cnt])
    plt.legend(loc='upper right', fancybox=True, fontsize=8)
    plt.tight_layout()
    plt.show()
Histograms