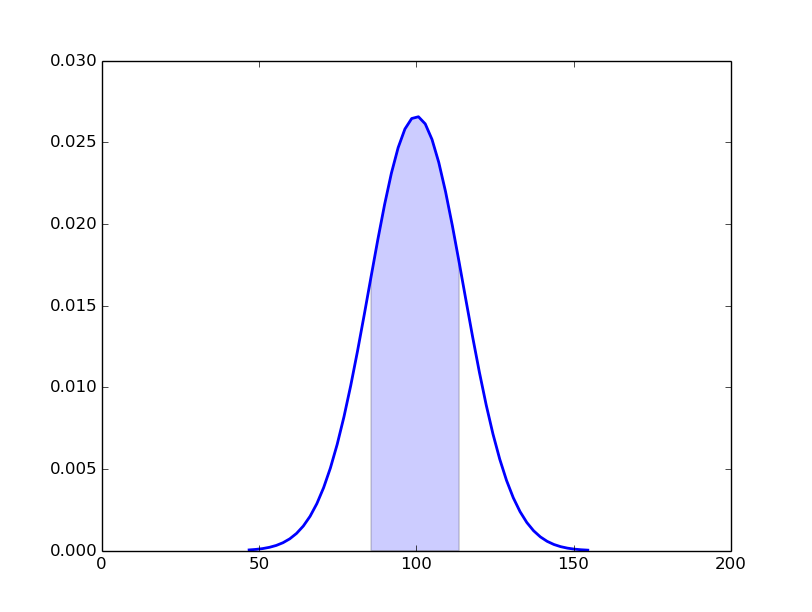
Colour fill density plot
Date: February 28th 2016
Last updated: February 28th 2016
Adding colour fill to a density plot can be done using fill_between function.
import matplotlib.pyplot as plt
import matplotlib.mlab as mlab
from random import gauss
import numpy as np

# create data
mu, sigma = 100, 15
x = [gauss(mu, sigma) for i in range(10000)]
# histogram
n, bins, patches = plt.hist(x, 50, normed=1, facecolor='white')
# clear figure so bins are removed
plt.clf()
# create pdf and density function
pdf = mlab.normpdf(bins, mu, sigma)
# plot pdf and color
plt.plot(bins, pdf, 'b-', linewidth=2)

# slice data by sd
sd1_indices = np.where((bins >= mu - sigma) *
                        (bins <= mu + sigma))
sd1_bins = bins[sd1_indices]
sd1_pdf = pdf[sd1_indices]

# plot density colours
plt.fill_between(sd1_bins, sd1_pdf, facecolor='blue',alpha=0.2)
plt.ylim(0, 0.03)
plt.xlim(0, 200)
plt.show()
The plot is normalised using norm=1. The histogram bins were cleared using clf() before plotting the density function.The area under the curve represents one standard deviation. The data were subset based on indices for bins falling inside 1 sd using numpy.where().