Poisson distribution
Date: March 2nd 2016
Last updated: March 2nd 2016
"A poisson distribution is a discrete probability distribution that expresses the probability of a given number of events occurring in a fixed interval of time and/or space if these events occur with a known average rate and independently of the time since the last event." plucked straight out of Wikipedia (https://en.wikipedia.org/wiki/Poisson_distribution).
Formula for calculating Probability Mass Function
$$ P(k events in interval) = \frac{\lambda^k e^{-\lambda}}{k!}
$$
- lambda = Avg
- e = Eulers number (2.71828..)
- k = number of events
- k! = factorial
The equation was created using two dollar signs ($$) on either side of the equation:
E.g.
# NRL (Rugby League) - Roosters 2015 game stats
# The average number of tries = 4.17
# The probability of 2 tries per match:
((4.17**2) * (2.71828** -4.17)) / (2*1)

# output
# 0.13434927987839906

# results
# 1 try:   0.064
# 2 tries: 0.134
# 3 tries: 0.187
# 4 tries: 0.195
# 5 tries: 0.162
# 6 tries: 0.113
Python code to calculate PMF
#computes the Probability Mass Function at values x
# in the case of discrete distributions
dist = poisson(4.17)
# look at items in dist
dist.__dict__
#{'kwds': {}, 'args': (4.17,), 'a': 0, 'b': inf,
#    'dist': <scipy.stats._discrete_distns.poisson_gen object #at 0x7f69d2a275c0>}
# find pmf
dist.pmf(x)
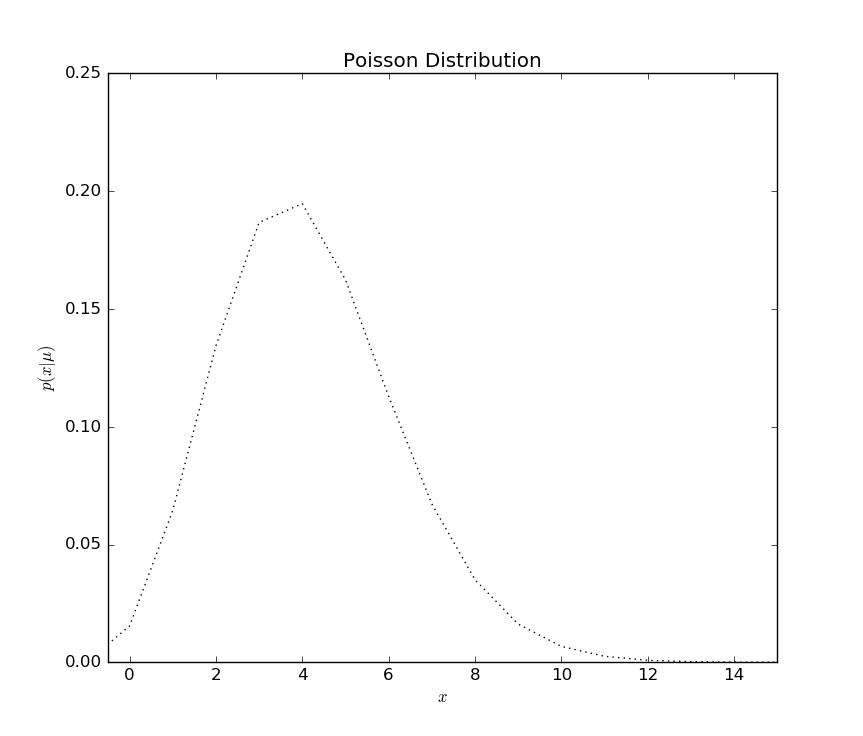
Example
Source: http://www.astroml.org/book_figures/chapter3/fig_poisson_distribution.html
import numpy as np
from scipy.stats import poisson
from matplotlib import pyplot as plt

mu = 4.17
ls = ':'
fig, ax = plt.subplots(figsize=(5, 3.75))

dist = poisson(mu)
# create sequential set of numbers
# array([-1,0,1,2,3 ... 198, 199])

# plot pmf
x = np.arange(-1, 200)
plt.plot(x, dist.pmf(x), ls=ls, color='black')

# add plot attributes
plt.xlim(-0.5, 15)
plt.ylim(0, 0.25)
plt.xlabel('$x$')
plt.ylabel(r'$p(x|\mu)$')
plt.title('Poisson Distribution')
plt.show()
Output
Note the use of math syntax in x and y labels. Syntax using $ symbol also used in the equation at the top of the page.