Matplotlib adding to existing plots
Date: March 5th 2016
Last updated: March 5th 2016
In this example, each click on the play button renders additional attributes to a figure. I didn't arrive at this intentionally. I was actually trying to replace each figure when the play button was clicked. I imagine that this code will come in handy at some point in the future.
main.py
"""
Keeps the same graph 'window'.
Plots new bins overtop of existing plot.
"""

import matplotlib
matplotlib.use('module://kivy.garden.matplotlib.backend_kivy')
import matplotlib.pyplot as plt
from kivy.garden.matplotlib.backend_kivyagg import FigureCanvas
import kivy
kivy.require('1.9.1')
from kivy.app import App
from kivy.uix.boxlayout import BoxLayout
from kivy.uix.button import Button
import matplotlib.mlab as mlab
from random import gauss
import random
import numpy as np

class DrawPlot(BoxLayout):
    def __init__(self, **kwargs):
        super(DrawPlot, self).__init__(**kwargs)

    def get_data(self):
        x = [gauss(100, 15) for i in range(100)]
        return x

    def draw_plot_frame(self):
        self.fig, self.ax = plt.subplots()
        self.ax.set_xlim([0, 200])
        canvas =  FigureCanvas(figure=self.fig)
        self.add_widget(canvas, 1) #<===== builds initial plot window

    def plot(self):
        x = self.get_data()
        colorlist = ['blue','red','green','yellow']
        facecolor = colorlist[random.randint(0,3)]
        n, bins, patches = self.ax.hist(x, 50, normed=1, facecolor=facecolor, alpha=0.3)
        pdf = mlab.normpdf(bins, 100, 15)
        self.ax.plot(bins, pdf, 'r-', linewidth=2)
        canvas = self.fig.canvas
        canvas.draw() #<===== this adds stuff from plot() to the existing plot window

class SampleApp(App):
    def build(self):
        return DrawPlot()

if __name__ == '__main__':
    SampleApp().run()
sample.kv
#:kivy 1.9.1
<DrawPlot>:
    orientation: 'vertical'

    BoxLayout:
        orientation: 'vertical'
        size_hint: 1, None
        height: main_title.height

        Label:
            id: main_title
            text: "Plotting using Matplotlib in Kivy"
            font_size: '35sp'
            size_hint: 1, None
            height: self.height

        Label:
            size_hint_x: 0.8
            source: root.draw_plot_frame() #<==== creates initial plot window


    BoxLayout:
        orientation: 'horizontal'
        size_hint: 1, None
        height: playbutton.height
        Button:
            id: playbutton
            text: 'play'
            size_hint: 1, None
            height: self.height
            on_press: root.plot() #<==== add stuff to existing plot

        Button:
            text: 'reset'
            size_hint: 1, None
        Button:
            text: 'quit'
            size_hint: 1, None
Output
The following screenshot is produced when running the main program.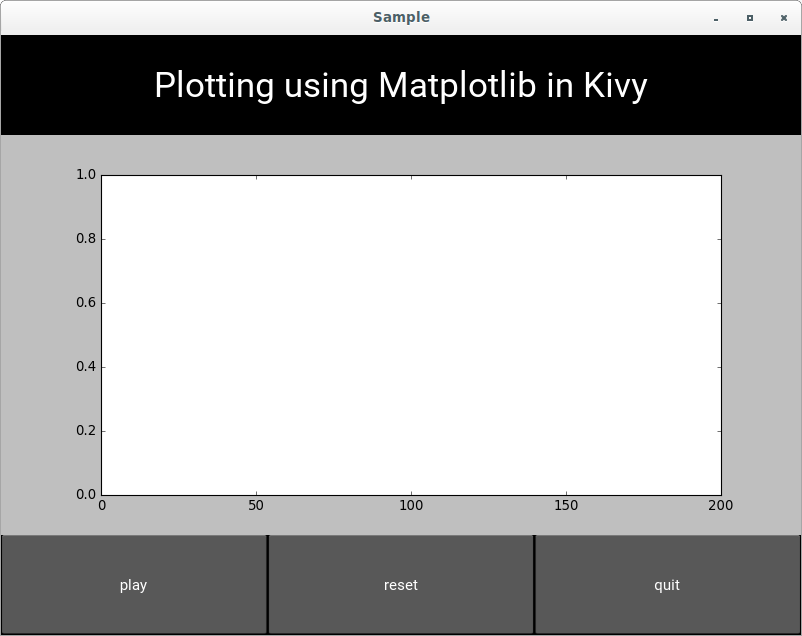
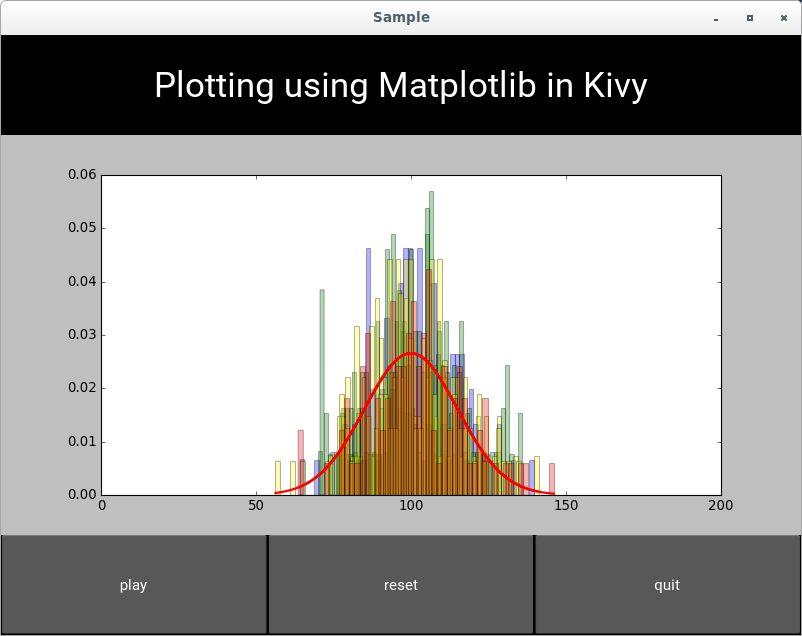
After clicking on the play button several times I got the following image. Note that the colours are chosen at random (blue, red, green, yellow) to fill in the histogram bins. Reset and quit buttons do nothing.