Realtime plotting
Date: March 8th 2016
Last updated: March 9th 2016
I found the following example on stackoverflow: http://stackoverflow.com/questions/24783530/python-real-time-plotting. In this thread there is an example of redrawing on a figure canvas to emulate realtime plotting. Here I have annotated some of the code. The reason I added this was because of the method to reset y data in a figure canvas (i.e. li.set_ydata(y)). I think I'll use this in the future.
import matplotlib.pyplot as plt
import numpy as np
import time

fig = plt.figure()
ax = fig.add_subplot(111)
# same as...
# fig, ax = plt.subplots()

# X and Y data
x = np.arange(1000)
y = np.random.randn(1000)
li, = ax.plot(x, y)
# note the comma after li
# print li ---> Line2D(_line0)

# draw and show it
# Up to this point is standard plotting
fig.canvas.draw()
plt.show(block=False)

# if you dont use block the image is static
# and only the first image is rendered
# you also get a TK error on fig.canvas.draw() in the while loop
#plt.show()

# loop to update the data
while True:
    try:
        # drops first ten elements and shifts
        # every element except the last ten elements
        # broadcast only takes the same length of arrays
        # e.g. y[:-10] = y[9:] doesnt work
        y[:-10] = y[10:]
        # replace the last 10 elements with new random numbers
        # these stayed as they are in the last step
        y[-10:] = np.random.randn(10)

        # set the new data
        li.set_ydata(y)
        fig.canvas.draw()

        time.sleep(0.1)
    except KeyboardInterrupt:
        break
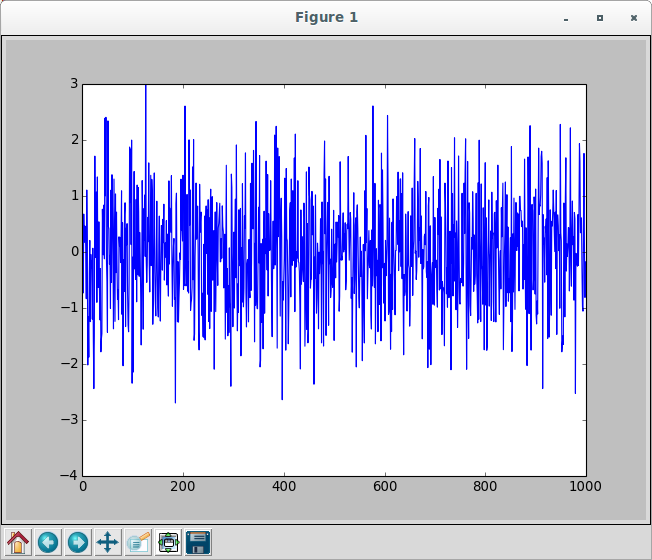
Output
Note that the figure canvas is not redrawn, only the y values are redrawn every tenth of a second. The blue band moves from right to left (100 elements per second).

Side note
When I moved from one computer to another I found I had dependency problems using matplotlib. The solution was found at http://askubuntu.com/questions/578129/plotting-with-matplotlib-in-python-3-pylab-tkinter-and-qt-fontmanager-errors.
# The error
AttributeError: 'FontManager' object has no attribute 'ttf_lookup_cache'

# The solution
rm /home/ray/.cache/matplotlib/fontList*.cache