Matplotlib Backend
Date: February 29th 2016
Last updated: February 29th 2016
Getting matplotlib working in kivy was a challenge. First I had issues getting matplotlib working in a virtual environment. Second I had issues plotting to the parent canvas which would end up masking other buttons etc.
Installing
cd path/to/venv/
source bin/activate
sudo apt-get update
sudo apt-get -y build-dep matplotlib

pip install kivy-garden
garden install matplotlib
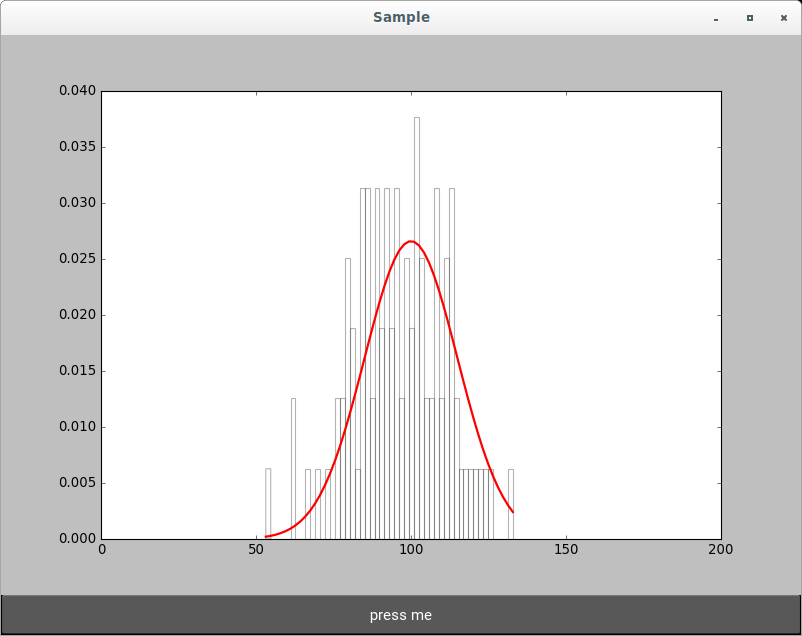
Simple histogram example (no kv file)
import matplotlib
matplotlib.use('module://kivy.garden.matplotlib.backend_kivy')
import matplotlib.pyplot as plt
from kivy.garden.matplotlib.backend_kivyagg import FigureCanvas
import kivy
kivy.require('1.9.1')
from kivy.app import App
from kivy.uix.boxlayout import BoxLayout
from kivy.uix.button import Button
import matplotlib.mlab as mlab
from random import gauss

# create data
fig, ax = plt.subplots()
x = [gauss(100, 15) for i in range(100)]
n, bins, patches = ax.hist(x, 50, normed=1, facecolor='white', alpha=0.3)
pdf = mlab.normpdf(bins, 100, 15)
ax.plot(bins, pdf, 'r-', linewidth=2)
ax.set_xlim([0, 200])

# kivy specific wrapper to plot a figure in a widget
canvas = FigureCanvas(figure=fig)

# create app
class SampleApp(App):
    def build(self):
        fl = BoxLayout(orientation="vertical")
        a = Button(text="press me", height=40, size_hint_y=None)
        fl.add_widget(canvas)
        fl.add_widget(a)
        return fl

if __name__ == '__main__':
    SampleApp().run()
Output