Barcharts
Date: March 7th 2016
Last updated: March 7th 2016
This is a reminder about bar sizing and adding additional groups. The example is adapted from http://matplotlib.org/examples/pylab_examples/barchart_demo.html.
"""
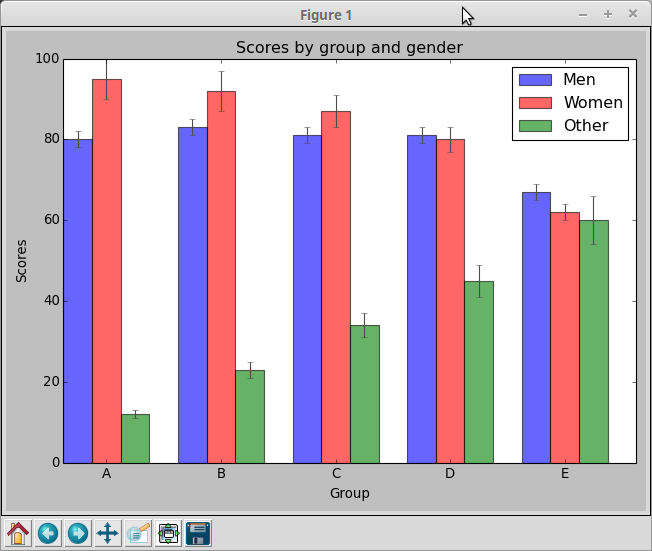
Bar chart demo with pairs of bars grouped for easy comparison.
"""
import numpy as np
import matplotlib.pyplot as plt
n_groups = 5
# three datasets (mean and std)
means_men = (80, 83, 81, 81, 67)
std_men = (2, 2, 2, 2, 2)
means_women = (95, 92, 87, 80, 62)
std_women = (5, 5, 4, 3, 2)
other = (12,23,34,45,60)
std_other = (1,2,3,4,6)
fig, ax = plt.subplots()
index = np.arange(n_groups) # creates a list -> [0,1,2,3,4]
bar_width = 0.25
# decrease this bar_width value if more groups are added
# otherwise the bars will overlap between groups
opacity = 0.6
error_config = {'ecolor': '0.3'}
rects1 = plt.bar(index, means_men, bar_width,
alpha=opacity,
color='b',
yerr=std_men,
error_kw=error_config,
label='Men')
rects2 = plt.bar(index + bar_width, means_women, bar_width,
alpha=opacity,
color='r',
yerr=std_women,
error_kw=error_config,
label='Women')
# placement for the 3rd bar is a multiple of 2 bar widths along x
# Note that bar_width is a multiple of 2
rects3 = plt.bar(index + bar_width*2, other, bar_width,
alpha=opacity,
color='g',
yerr=std_other,
error_kw=error_config,
label='Other')
plt.xlabel('Group')
plt.ylabel('Scores')
plt.title('Scores by group and gender')
# tick labels in the center of 3 bars
# e.g. 1 + (0.25 * 1.5) = 1.375
plt.xticks(index + (bar_width*1.5), ('A', 'B', 'C', 'D', 'E'))
plt.legend()
# modify margin size and fit the graph to the plotting window
plt.tight_layout()
plt.show()